Chrome DevTools: using Logpoints for on-demand JavaScript debugging.
Intro
This short post is an addition to my previous post about logging in JavaScript– Logging and debugging in JavaScript. A few methods I use on a daily basis.
Google Chrome v73 introduced a cool new feature I’d like to share with you. It’s called logpoints and it’s meant to make it easier to debug the source code of a web app. It’s not a new concept, but now it’s accessible through Google Chrome and VSCode.
What are Logpoints? When and where to use them?
Logpoints are variants of breakpoints that just… don’t break the execution of your code. They are meant to be used when you don’t want to stop and reload your app but you need to see the value of certain variables during runtime. You can add logpoints to the source code on the fly by “injecting” the logging statements into your application logic. The output will be just like when you put console.log’s in your code. Using them, you could for example inspect how state mutates throughout the lifetime of your app. You can also use them to make assertions and counts, just like with console methods I described here.
Another great feature of logpoints is that they are not persisted in your code, so you can just restart your devtools and you won’t have to deal with removing all the statements from your code in IDE.
How to use Logpoints?
I wrote a really simple function that increments the variable from 0 to 10 with a timeout of one second.
|
|
If we run this code in the browser we won’t see any feedback, because there are no logs inside. Let’s put one.
You can do this by right-clicking the line number near your source code and selecting “Add logpoint…” option.
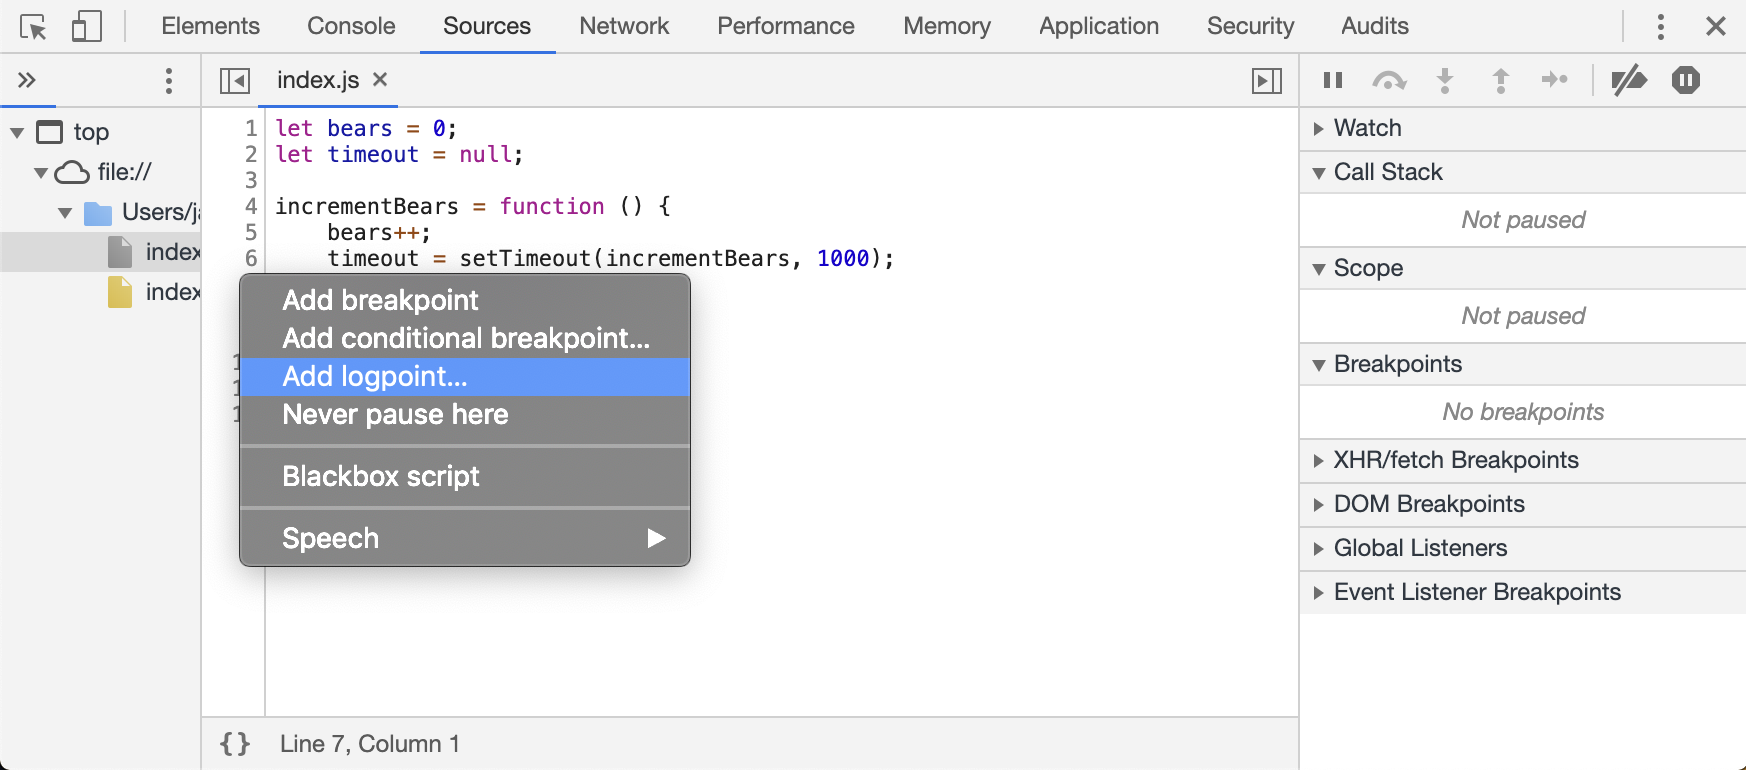
From there we can describe our message and variables we want to log.
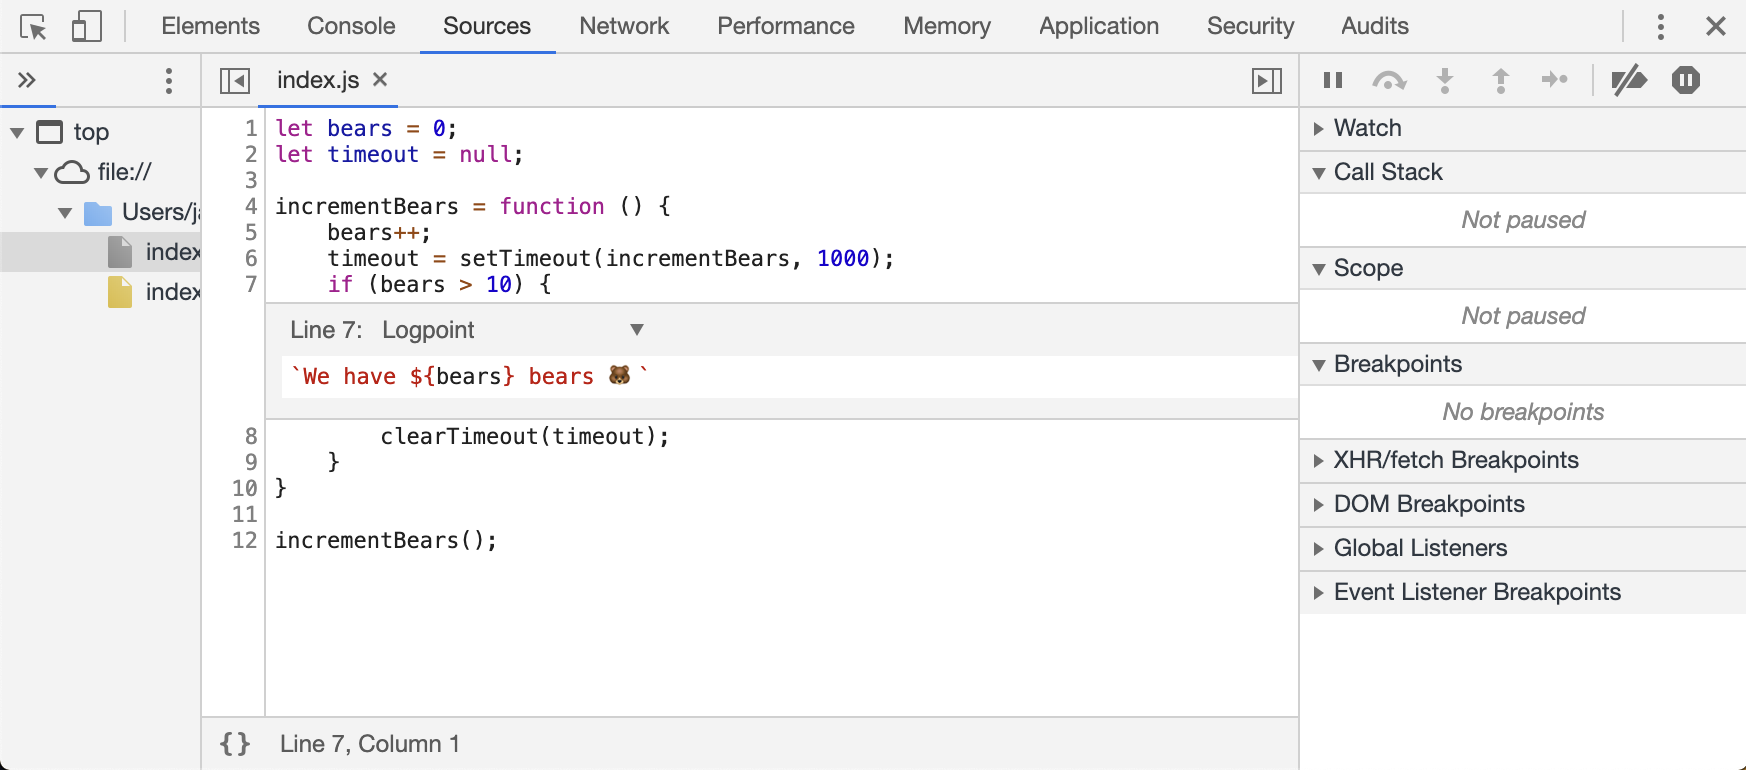
After refreshing the tab, we’ll see that we have our message in the console displayed every second.
Let’s add another one, this time, let’s put it inside the if statement (line 8). I’ll also change the timeout to 2 seconds so that I can show you that we can insert logpoints during runtime.
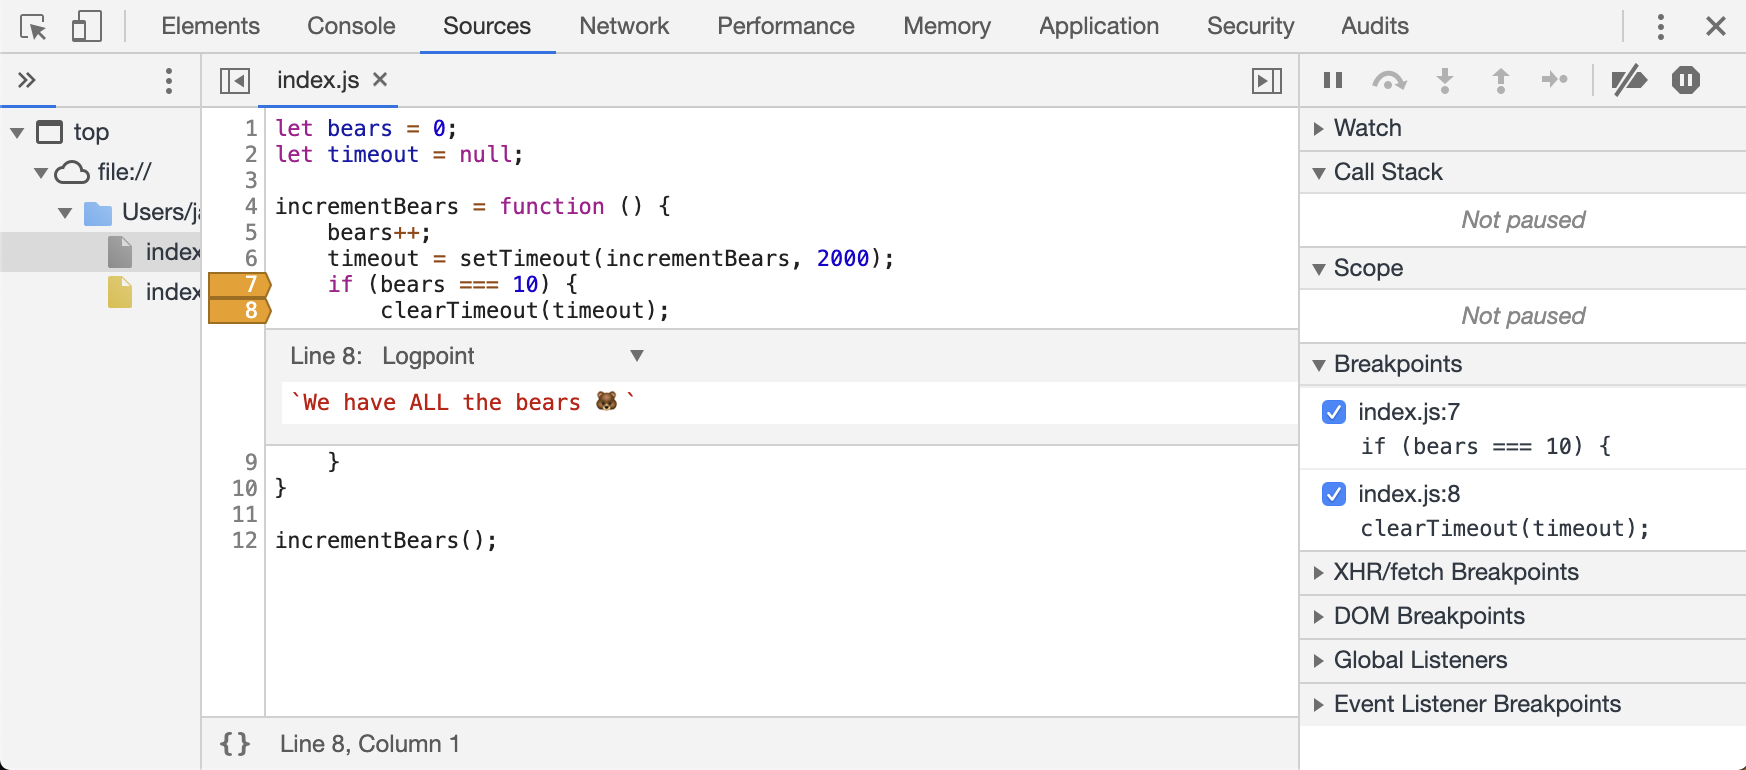
For this example I’ve used “LOL 🤪” message, because I’m that mature, but you can use whatever you want, you know? For example you can put expressions in {} and they’ll be interpolated!
Use logpoints in VSCode
You can easily place logpoints inside of VSCode by following the same steps described before. Right click, choose “Add Logpoint…” and insert your message. Keep in mind that you need to have your debugger attached to chrome’s process in order to debug your app from VSCode. You can do that by creating launch or attach configs, or by using auto-attach for node (more about this here).
Debugging production apps?
You can use logpoints in order to debug your production apps, but when it comes to Javascript, our sites are often minified and obfuscated on production. Of course you can disable those mechanisms for a few days before the app “stabilises” so that you can debug it without stopping the whole environment or putting console.logs in production code.
Summary
That’s it for this quick tutorial. This concept isn’t new, but it is helpful and it let’s you save some time and nerves. Remember how to use logpoints in case your next production debugging session looks like this…

Hey, one more thing. I’ve created the graphics with the help of www.vecteezy.com